Hi all. This is the first article in a series about Microsoft Excel. Today you will learn:
- What is Microsoft Excel
- What is it for?
- What does his workspace look like?
In the next article we will discuss the program's working environment a little more. But we’ll be in the third post of this series, so the most interesting things are very close! In the future, we will focus on practice, since it is interesting to everyone.
To master this and subsequent articles in the series, you will need a computer with Microsoft Office, including Excel. If you do not have this program yet, you can buy it, for example, here.
What is Excel and what to use it for
Microsoft Excel is a program with a tabular structure that allows you to organize data tables, systematize, process them, build graphs and diagrams, perform analytical tasks and much more. Of course, this is not the entire list of capabilities, as you will soon see as you study the course materials. The program can perform many useful operations for you, which is why it has become a worldwide hit in its industry.Excel workspace
An Excel workspace is called a workbook, which consists of worksheets. That is, one workbook file can contain one or more tables called Sheets. Each sheet consists of many cells that form a data table. The rows are numbered sequentially from 1 to 1,048,576. The columns are named with the letters A through XFD. Cells and coordinates in ExcelIn fact, these cells can store huge amount information, much more than your computer can process. Each cell has its own coordinates. For example, the cell at the intersection of the 3rd row and 2nd column has coordinates B3 (see figure). The cell coordinates are always highlighted in color on the sheet; look in the picture at what the number of the third line and the letter of the second column look like - they are darkened.By the way, you can place data in any order on the sheet; the program does not limit your freedom of action. This means you can easily create various reports, forms, layouts and choose the optimal place for.
Now let's take a look at the Excel window as a whole and understand the purpose of some of its elements:
 Excel workspaceThis concludes our first lesson. We have reviewed the appointment Excel programs and the main (not all) elements of her worksheet. In the next lesson we will look at. Thank you for reading this article to the end, keep it up! If you have any questions, write in the comments, I will try to answer everything.
 Microsoft Excel is a program for performing calculations and managing so-called spreadsheets.
Excel allows you to perform complex calculations that can use data located in different areas of the spreadsheet and connected to each other by a certain dependency. To perform such calculations in Excel, it is possible to enter various formulas into table cells. Excel performs the calculation and displays the result in the formula cell. The available formulas range from simple addition and subtraction to financial and statistical calculations.
An important feature of using a spreadsheet is the automatic recalculation of results when cell values change. For example, you can use Excel to perform financial calculations, record and control the organization's personnel, etc. Excel can also build and update graphs based on entered numbers.
The file that Excel works with is called a book . A book, as a rule, consists of several worksheets that may contain tables, texts, diagrams, and drawings.
The book is a good organizational tool. For example, you can collect all documents in one book ( worksheets), related to a specific project (task), or all documents maintained by one executor. The base of the worksheet (Fig. 1) is a grid of rows and columns. Cell formed by the intersection of a row and a column. The cell(s) selected by the mouse is called active (in Fig. 1, the active cell is highlighted with a frame).
A row in a worksheet is identified by a name (number) that appears on the left side of the worksheet.
A column in a worksheet is also identified by a name (letters of the Latin alphabet) that appears at the top of the worksheet.
An Excel worksheet can contain up to 65,536 rows and 256 columns. A cell - the main element of a table - has its own unique address, consisting of a column and row number, for example E4 .
Each cell contains one piece of information, be it a numeric value, text, or a formula.
When you open a previously created file, a workbook with the entered data appears in the Excel window.
Workbook in Excel, it is a file in which data is stored and analyzed. A workbook file consists of several worksheets that can contain tables, text, charts, or pictures. Each worksheet is identified by a name that appears on the worksheet label.
Let's look at specific elements of the Excel window (Fig. 2).
| Rice. 2. Excel window |
Status bar contains information about the active document, the selected menu command, and keyboard mode indicators. In it, the user receives messages on how to complete the started command and view the intermediate results of some calculations.
Formula bar shows the formula (if present in the cell) or data contained in the active cell. You can enter and edit text, numbers, and formulas in the formula bar.
IN active cell You can enter and edit data directly in a cell or in the formula bar.
Scroll buttons The windows at the bottom left are used to view sheet shortcuts and to move between sheets in a workbook containing a large number of sheets.
Microsoft Excel is one of the most popular programs for working with large amounts of data, which is essentially a spreadsheet editor. The wide functionality of the application does not limit the user to only editing already created tables, but allows you to create completely new ones, entering your own data.
The many mathematical, statistical and other functions built into Excel allow you to generate reports and carry out even the most complex calculations in one click, and a wide library of templates and a charting wizard will easily present all the information in graphical form, emphasizing and highlighting the necessary connections and trends. That is why, if you often have to deal with large volumes of information, carry out calculations, draw up reports and carry out other similar work, you can download Microsoft Excel for free right now and see from your own experience all the advantages of working with this software product.
A wide and varied toolkit makes Excel indispensable for people working in the fields of economics, finance and accounting. By creating tables and hierarchical relationships between them, you can not only store information, but also quickly access the necessary data, using the ability to sort and filter according to various criteria.
Microsoft Excel Features
- Compiling tables with various types of data (numeric, text, date, monetary, time, etc.).
- Wide range of formatting options for both the entire sheet and each cell separately.
- Import and export data among other Microsoft Office applications.
- Automatic and customizable sorting of information according to various criteria.
- Built-in data search.
- Use of graphical objects, including charts, graphs and histograms of all types.
- High degree of information security.
- Collaboration on projects.
One of the most important advantages of Microsoft Excel is that every user can download free version program and independently evaluate all its advantages. It is worth noting the fact that each new release of Excel contains updates such as appearance, and functional content. That's why, before you decide to install a specific version on your computer, be sure to check out system requirements, which are presented in the description of each release.
It can greatly facilitate the user’s work with tables and numerical expressions by automating it. This can be achieved using the application's tools and its various functions. Let's look at the most useful of them.
Due to the wide functional purpose of the program, the user is not always aware of the capabilities that simplify interaction with many Excel tools. Later in the article we will talk about 10 best features, which can be useful for various purposes, and we will also provide links to detailed lessons on working with each of them.
VLOOKUP function
One of the most requested features in Microsoft Excel is "VLOOKUP". By using it, you can drag and drop values from one or more tables into another. In this case, the search is performed only in the first column of the table, thus, when the data in the source table is changed, data is automatically generated in the derived table, in which individual calculations can be performed. For example, information from a table containing price lists for goods can be used to calculate indicators in the table about the volume of purchases in monetary terms.
A VLOOKUP is started by inserting a statement "VPR" from "Function Masters" in the cell where the data should be displayed.
In the window that appears, after running this function, you need to specify the address of the cell or range of cells from which the data will be pulled.

Pivot tables
Another important function of Excel is the creation of pivot tables, which provides grouping of data from other tables according to various criteria, execution various calculations with them (summation, multiplication, division, etc.), and the results are displayed in a separate table. At the same time, there are very wide possibilities for customizing the fields of the pivot table.

It is created on the tab "Insert" by pressing the button, which is called - "Pivot table".

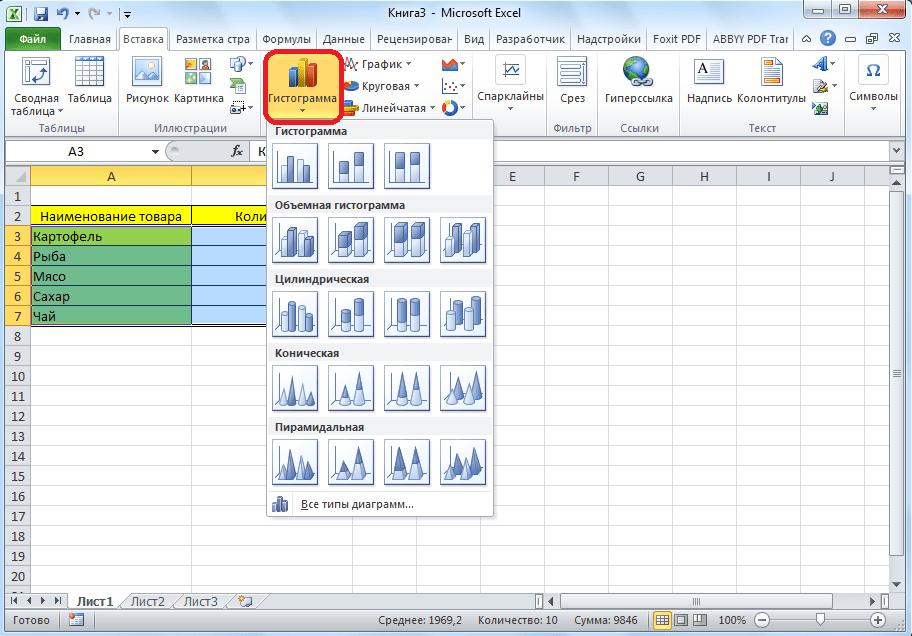
Creating Charts
To visually display data placed in a table, it is convenient to use charts. They are often used for creating presentations, writing scientific papers, for research purposes, etc. Excel provides a wide range of tools for creating various types diagrams.

To create a chart, you need to select a set of cells containing the data that you want to visually display. Then, while on the tab "Insert", select on the ribbon the type of diagram that you consider most suitable for achieving your goals.
More precise setup of charts, including setting its name and axes names, is done in the group of tabs "Working with diagrams".

One type of chart is graphs. The principle of their construction is the same as that of other types of diagrams.

Formulas in Excel
To work with numerical data, the program allows you to use special formulas. With their help, you can perform various arithmetic operations with data in tables: addition, subtraction, multiplication, division, exponentiation, root extraction, etc. To apply the formula, you need to put the sign in the cell where you plan to display the result «=» . After this, the formula itself is entered, which can consist of mathematical symbols, numbers and cell addresses. To indicate the address of the cell from which the data for calculation is taken, just click on it with the mouse, and its coordinates will appear in the cell for displaying the result.

Excel is also convenient to use as a regular calculator. To do this, in the formula bar or in any cell, simply enter mathematical expressions after the sign «=» .

"IF" function
One of the most popular functions used in Excel is "IF". It makes it possible to specify in a cell the output of one result if a specific condition is met and another result if it is not met. Its syntax is as follows: IF(Boolean expression; [result if true]; [result if false]) .

Operators "AND", "OR" and nested function "IF" matches several conditions or one of several conditions.
Macros
Using macros, the program records the execution of certain actions, and then they are played back automatically. This significantly saves time on execution large quantity same type of work. Macros are recorded by enabling the capture of your actions in the program through the corresponding button on the ribbon.

Macros can also be recorded using the Visual Basic markup language in a special editor.

Conditional Formatting
To highlight specific data, a table uses conditional formatting to set rules for highlighting cells. The conditional formatting itself can be done in the form of a histogram, color scale, or set of icons. You can access it through the tab "Home" highlighting the range of cells you are going to format. Next in the tools group "Styles" click the button named "Conditional Formatting". After this, all you have to do is select the formatting option that you consider most suitable.

The formatting will be completed.

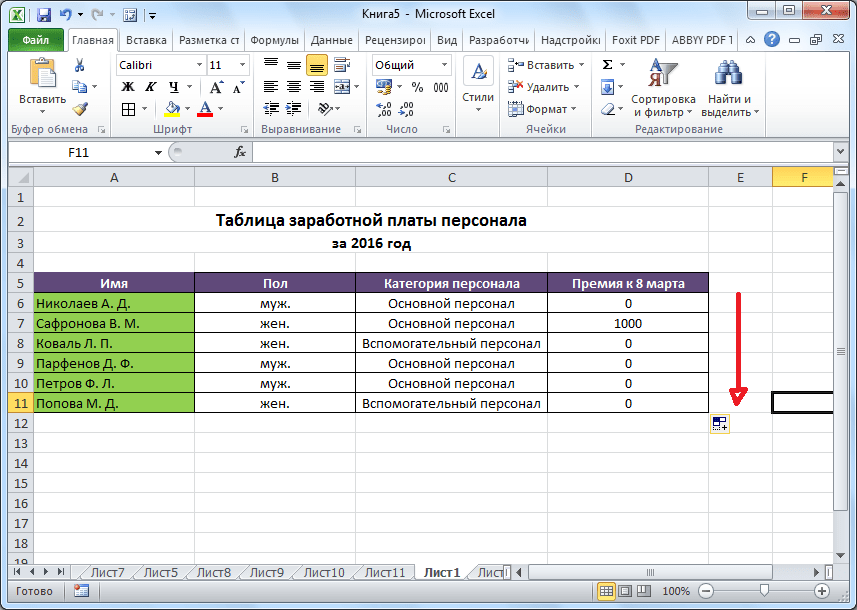
Smart table
Not all users know that a table simply drawn with a pencil or borders is perceived by Excel as simple area cells. You can force the program to see this data set as a table through reformatting. This is done simply: first, select the desired range with data, and then, being on the tab "Home", click on the button "Format as table". A list will appear with various options design styles, where indicate the appropriate one.

The table is also created by clicking the button "Table", which is located on the tab "Insert", having previously selected a certain area of the sheet with data.

The editor will treat the selected set of cells as a table. As a result, for example, if you enter some data into the cells located at the borders of the table, they will be automatically included in it. In addition to this, when scrolling down, the header will be constantly within the field of view.

Parameter selection
Using the parameter selection function, you can select the initial data, guided by the result you want. Go to the tab "Data" and press the button "What If Analysis" located in the toolbox "Working with data". In the list that appears, select the item “Selection of parameter...”.

The parameter selection window will open. In the field "Set in cell" you must provide a reference to the cell that contains the formula you want. In the field "Meaning" the end result you want must be specified. In the field "Changing cell values" insert the coordinates of the cell with the value being adjusted.

INDEX function
Features the function provides "INDEX", somewhat close to the capabilities of the function "VPR". It also allows you to search for data in an array of values and return it to a specified cell. The syntax is as follows: INDEX(cell_range, row_number, column_number) .

This is not a complete list of all the functions that are available in Microsoft program Excel. We focused only on the most popular and most important of them.
“Microsoft Excel (also sometimes called Microsoft Office Excel) is a spreadsheet program created by Microsoft for Microsoft Windows, Windows NT and Mac OS. It provides economic and statistical calculation capabilities, graphical tools and, with the exception of Excel 2008 on Mac OS X, the macro programming language VBA (Visual Basic for Application). Microsoft Excel is part of Microsoft Office and today Excel is one of the most popular applications in the world" Source: Wikipedia.org
Microsoft Excel capabilities?
The areas and possibilities for using Excel are varied:
As can be seen from all of the above, the main focus of Excel is working with financial and analytical data, so ownership of this application is in demand in many types of activities related to calculations, reports, forecasting, etc. And an employee with in-depth knowledge is a gift
That's all for now! In the next lesson we will get acquainted with the MS Excel 2003 interface.
For those who want to delve into the history of the development of MS Excel, you can take a look at.